DBtune and HammerDB: Your guide to fair PostgreSQL benchmarking
Unlock up to 114% PostgreSQL performance improvement with DBtune and HammerDB: A practical guide to automating PostgreSQL optimization without code changes or hardware upgrades.

Making informed decisions about your database infrastructure for optimal application responsiveness and scalability requires accurate performance comparisons. When evaluating PostgreSQL against alternatives like Oracle or Microsoft SQL Server, such as for example this recent performance comparison by EDB, it's important to ensure a fair assessment. This blog post provides a practical approach to maximizing HammerDB's effectiveness in benchmarking PostgreSQL, specifically to avoid misleading conclusions that might arise from comparing an untuned PostgreSQL instance with an optimized alternative.
We will guide you through setting up realistic workloads and using key HammerDB features, demonstrating how DBtune can unlock a significant PostgreSQL performance boost, leading to the selection of a faster and more cost-effective database. You can replicate these experiments yourself by following the instructions in this GitHub repository, and here's how to get started with DBtune.
Understanding HammerDB and TPCC to fairly benchmark PostgreSQL against other databases
HammerDB is a well-established open-source database load-testing and benchmarking tool. It provides two primary benchmarks: TPCC which is an OLTP workload and TPCH which is analytical. For our performance analysis, we focused on TPCC, a widely recognized OLTP benchmarking standard. TPCC models an order-entry environment where numerous users execute transactions concurrently. This makes it an ideal tool for assessing how a database handles demanding OLTP workload performance.
The TPCC workload simulates a wholesale supplier’s order and delivery operations across multiple warehouses utilizing five key transactions:
- New order: Creating new customer orders.
- Payment: Recording customer payments.
- Order status: Querying existing order status.
- Delivery: Processing batch deliveries.
- Stock level: Checking stock levels.
Our environment for the HammerDB PostgreSQL benchmark
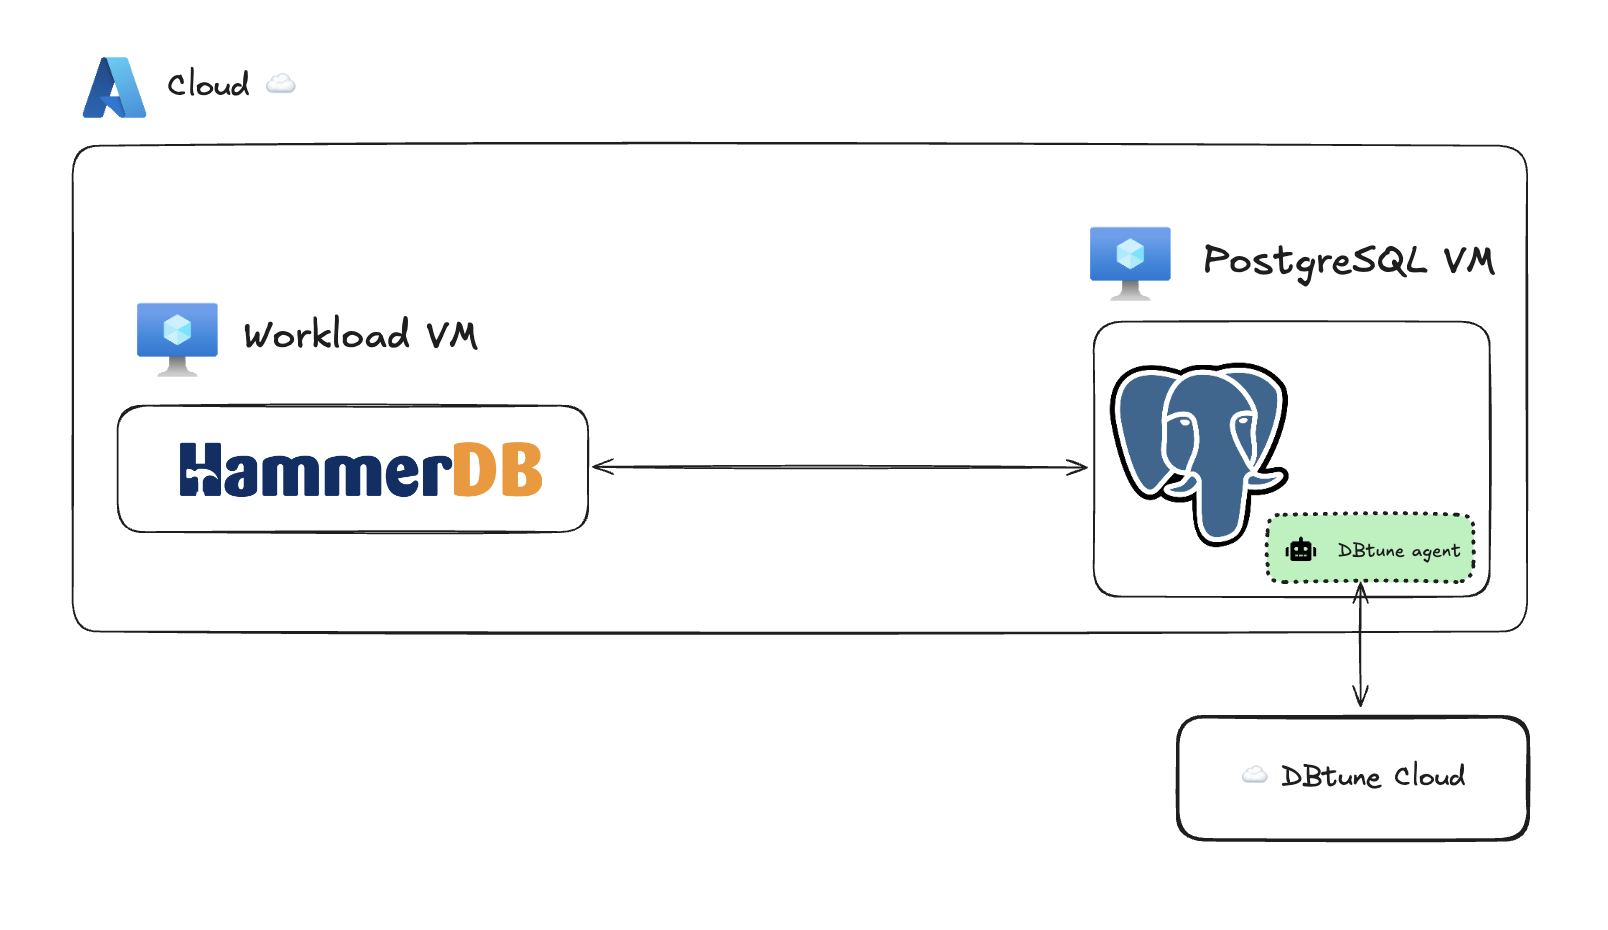
To ensure accurate HammerDB PostgreSQL performance measurements, we employed distributed benchmark environment using two identical Azure VMs: one for the database and one for the workload as explained in the figure:
- Client VM, which has the role of generating the workload:
- HammerDB v4.12 (latest version at time of writing available here).
- Platform: Ubuntu 24.04 LTS.
- Azure VM: Standard_D8ads_v6 (8 vCPUs, 32 GB RAM, 440 GB ephemeral disk).
- PostgreSQL VM, which has the role of hosting the database and process the transactions:
- DBtune open-source agent v0.1.1.
- Database engine: PostgreSQL 17.4.
- Platform: Ubuntu 24.04 LTS.
- Azure VM: Standard_D8ads_v6 (8 vCPUs, 32 GB RAM, 440 GB ephemeral disk).
This two-VM setup adheres to industry best practices for database benchmarking by separating the workload generator from the database server. This approach eliminates resource contention between HammerDB and PostgreSQL, ensuring that performance measurements accurately reflect the database's capabilities, rather than being influenced by the benchmark tool's resource consumption.
HammerDB’s remote network connection to the PostgreSQL server simulates a realistic client-server architecture, typical in production environments. This configuration enables us to measure genuine network-based transaction performance while providing the database server with dedicated resources for query processing.
Designing a realistic TPCC workload for PostgreSQL
The first step was building the TPCC schema using HammerDB's python script. A critical configuration in HammerDB is the number of warehouses, as this directly influences the database size and workload characteristics.
To determine the optimal warehouse count, we first checked our Azure VM's CPU socket count using lscpu | grep "Socket(s)"

This confirmed that our VM has a single CPU socket. Adhering to HammerDB documentation, the recommended range of warehouses is 250-500 per CPU socket, which ensures:
- Realistic workload distribution.
- Adequate data volume of approximately 52 GB.
- Balanced transaction distribution.
- Minimized artificial contention points.
We modified the schema build script (scripts/python/postgres/tprocc/pg_tprocc_buildschema.py) to implement this configuration, changing the default warehouse calculation from warehouse = int(vu) * 5 to warehouse = 500. In HammerDB, "vu" refers to the virtual users parameter, which represents concurrent client connections generating load.
We also updated the database connection parameters in the same HammerDB script, replacing the defaults with our PostgreSQL server details and administrator credentials to ensure proper database server connectivity.
diset('connection','pg_host','localhost')
diset('connection','pg_port','5432')
diset('tpcc','pg_superuser','postgres')
diset('tpcc','pg_superuserpass','postgres')
HammerDB's flexible schema creation capabilities enabled us to configure a realistic test environment while adhering to the standardized requirements of the TPCC benchmark.
HammerDB configuration for PostgreSQL OLTP workloads
Next, we configured the HammerDB PostgreSQL runner script (scripts/python/postgres/tprocc/pg_tprocc_run.py) to create a workload that would help establish reliable baseline metrics before tuning. We make a few key changes:
-
Disabling time profiling: We disabled time profiling by setting
diset('tpcc','pg_timeprofile','false'). Time profiling caches response times for each transaction, which can lead to significant memory consumption by HammerDB during extended runs. Since we planned a long-running test, disabling this was essential to prevent memory exhaustion. -
Extending run duration: We modified the default run duration from 5 minutes to 24 hours using
diset('tpcc','pg_duration','1440'). This extended duration is necessary because:- Allowed us to observe the system's behavior under sustained load.
- Ensured we go past the cache warmup phase.
- Provided adequate time for establishing baseline performance (first 12 hours). PostgreSQL performance metrics can fluctuate significantly during the initial hours of operation as the system builds up buffer caches, statistics, and query plans. We found that 12 hours was sufficient for our system to reach a steady state with consistent metrics.
- Allowed sufficient time for DBtune's complete tuning cycle.
-
Setting virtual users and connection limits: We made two changes:
- Modified PostgreSQL's max_connections to 300 (from the default of 100). This change was necessary to support our planned workload with 285 virtual users, as each virtual user requires a dedicated database connection.
- Set virtual users to 285 using
vuset('vu',285).
We chose these settings because on an 8-vCPU machine higher virtual user counts create a highly concurrent workload that helps expose system bottlenecks for tuning. Setting 285 VUs maximized our available connections (300) while reserving 15 for superuser and maintenance operations.
-
Warehouse distribution: We maintained the default setting
diset('tpcc','pg_allwarehouse','true'), which used all warehouses and distributes them among VUs, so they can pick a new warehouse at random for each transaction. This increased I/O activity by ensuring virtual users accessed distinct warehouses, simulating real-world applications where transactions interact with diverse data sets. -
Database credentials: We updated the script with the correct PostgreSQL superuser credentials.
diset('connection','pg_host','localhost')
diset('connection','pg_port','5432')
diset('tpcc','pg_superuser','postgres')
diset('tpcc','pg_superuserpass','postgres')
diset('tpcc','pg_total_iterations','10000000')
diset('tpcc','pg_rampup','2')
diset('tpcc','pg_duration','1440')
diset('tpcc','pg_allwarehouse','true')
diset('tpcc','pg_timeprofile','false')
diset('tpcc','pg_vacuum','true')
loadscript()
print("TEST STARTED")
vuset('vu',285)
vucreate()
tcstart()
tcstatus()
jobid = tclpy.eval('vurun')
HammerDB's flexible configuration options, including virtual users, warehouse distribution, and test duration, provided fine-grain control over our testing methodology. This made HammerDB particularly well-suited for performance tuning experiments.
Establishing a baseline performance for the untuned PostgreSQL database
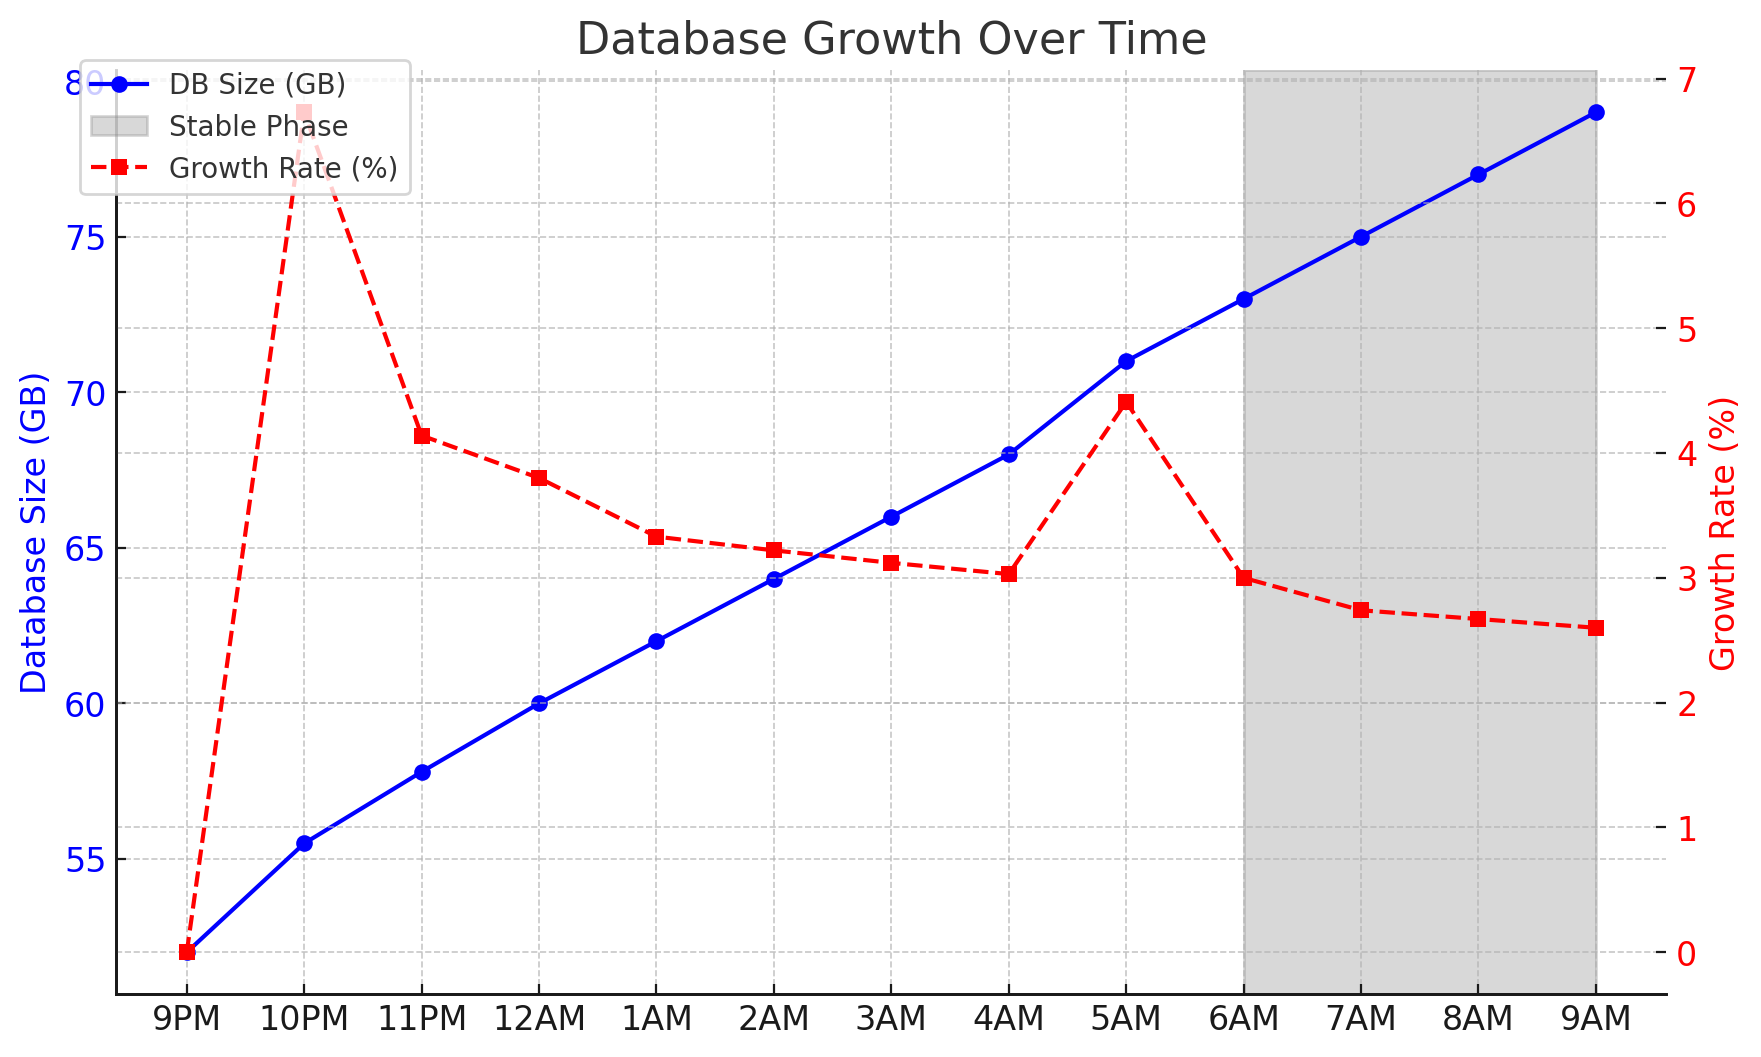
Following the loading of our initial 500-warehouse schema (approximately 52 GB), we establish a steady-state baseline performance. The HammerDB TPCC PostgreSQL benchmark is a write-heavy workload. The red line below shows the relative growth rate. At 9 PM, with a 52 GB database, the initial 3.5 GB growth resulted in a 6.73% increase, which is an unrealistic rate for typical real-world workloads. As the database size grew (see blue line moving up to the right below), it stabilized at around 2 GB per hour, resulting in a decreasing relative percentage. By 9AM (12-hour mark) , the relative growth dropped to 2.53% (red dashed line moving down to the right below).
To ensure realistic performance testing, we chose to start the tuning session in the stable state (right gray area) where relative growth had stabilized. This approach, mirroring a production environment, avoids artificially skewing our experiments with initial high-growth fluctuations.
Optimizing PostgreSQL performance with DBtune
With a stable benchmark baseline established we deployed DBtune for server parameter optimization. But first, what is DBtune?
DBtune is an AI-powered service that automates PostgreSQL server parameter tuning. Leveraging advanced machine learning and non-convex optimization techniques, it can analyze your database workload and suggest optimal configurations. DBtune continuously monitors hardware usage (CPU, memory, disk) and then adjusts PostgreSQL GUCs for peak performance. For HammerDB PostgreSQL users, DBtune offers several advantages:
- Automation: Fully automates server parameter tuning, reducing manual effort.
- Workload-specific optimization: Tailors settings for maximum PostgreSQL efficiency.
- Risk mitigation: Safely prevents performance degradation and memory overload by monitoring performance and memory during tuning.
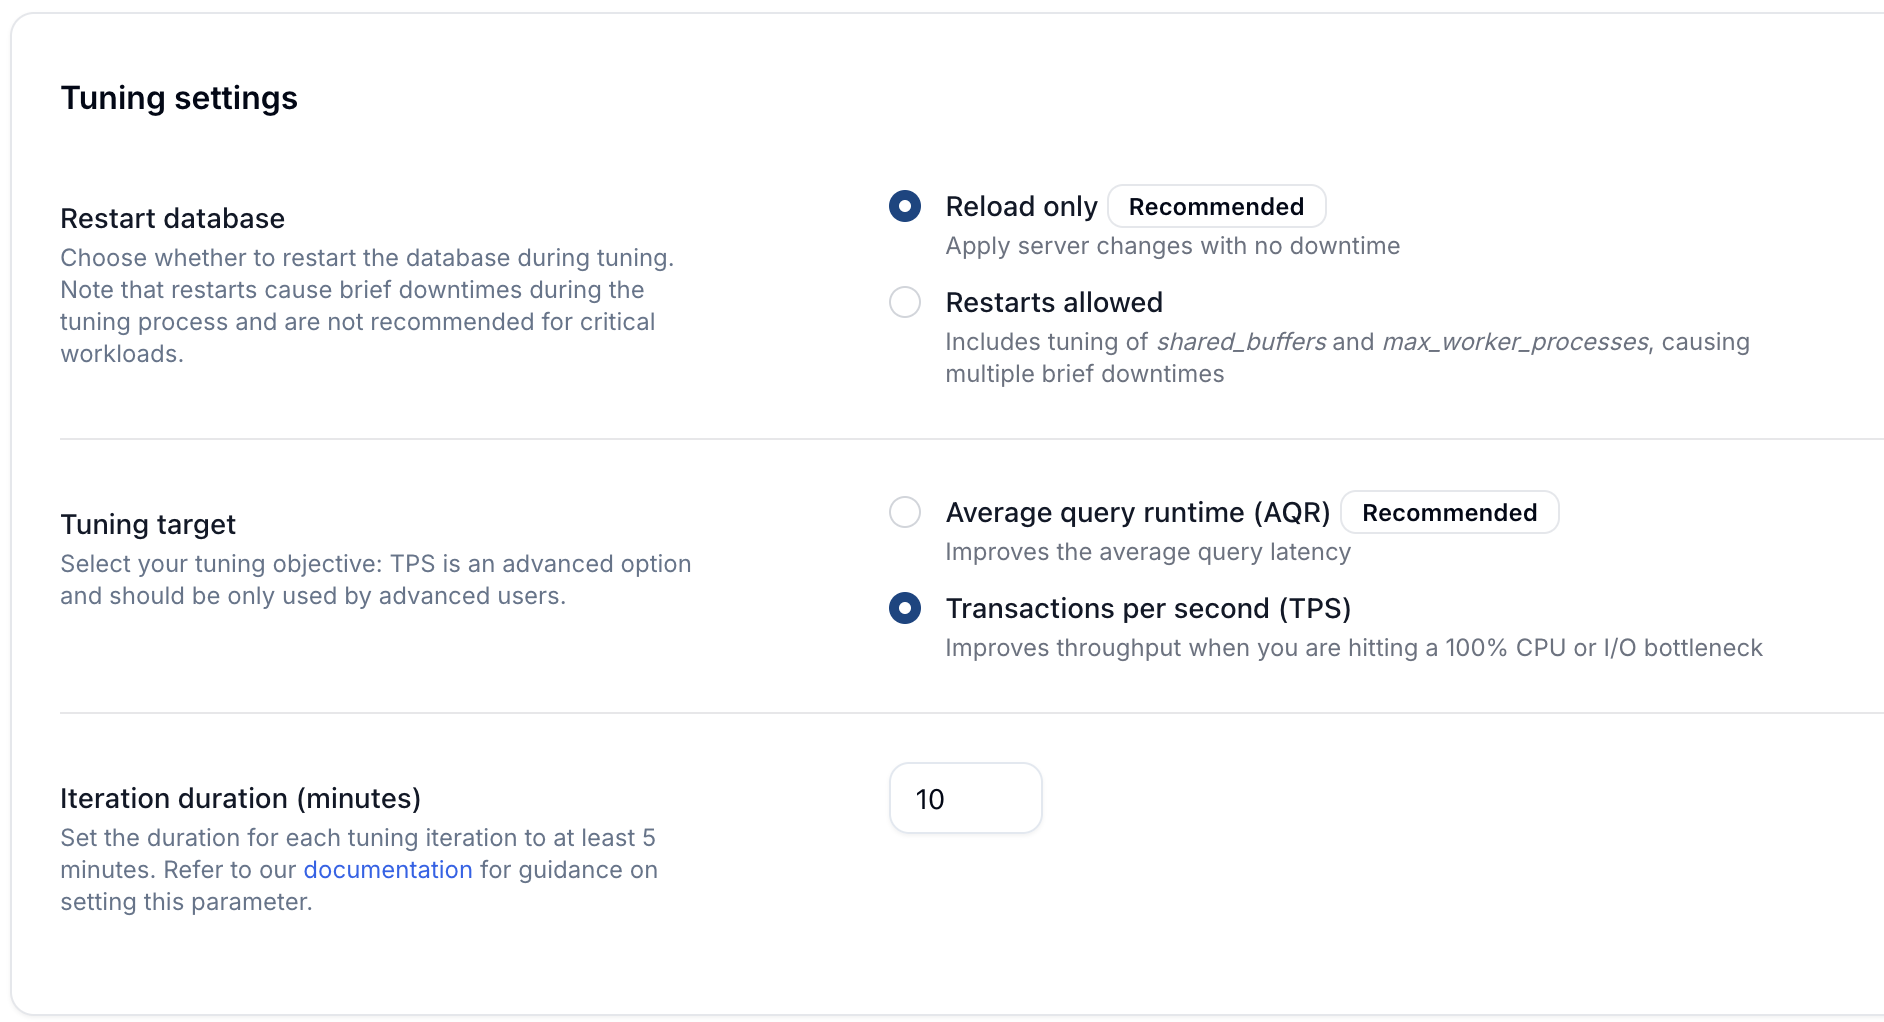
A full DBtune tuning session uses 30 iterations to test server parameters before providing a final configuration that delivers high performance based on your chosen tuning target — either minimizing average query runtime (AQR), which is a form of latency in ms, or maximizing transactions per second (TPS), which is a form of throughput. The best configuration is then automatically deployed. Read about which parameters DBtune tunes here.
We aimed to maximize TPS, as TPCC simulates an OLTP environment where throughput is critical. In real-world OLTP applications, like those simulated by TPCC (order processing, inventory management, payment processing), the number of completed transactions per second directly correlates with business capacity.
DBtune's simplicity allowed us to quickly set TPS as the target and a 10-minute iteration time window. This duration was chosen to allow sufficient time for database processes to stabilize. We experiment with both the option where the user allows the database to be restarted and the case where the user only allows database reloads, to prevent any server downtime.
From the DBtune user interface.
Benchmark results: DBtune vs PGTune vs PostgreSQL defaults
We performed four distinct experiments, summarized in the table below. Each tuning session lasts 5 hours and 15 minutes (30 iterations, 10 minutes per iteration), producing significant performance enhancements compared to PostgreSQL default and PGTune configurations. Whether starting from an already-optimized PGTune configuration (experiment 1 and 3) or from PostgreSQL defaults (experiment 2 and 4), DBtune increased TPS by 1.6x to 2.1x and AQR by 1.3x to 4x. The improvement in AQR while tuning for TPS is to be expected, as TPS and AQR are generally negatively correlated. These results highlight DBtune’s consistent effectiveness across different experiments.
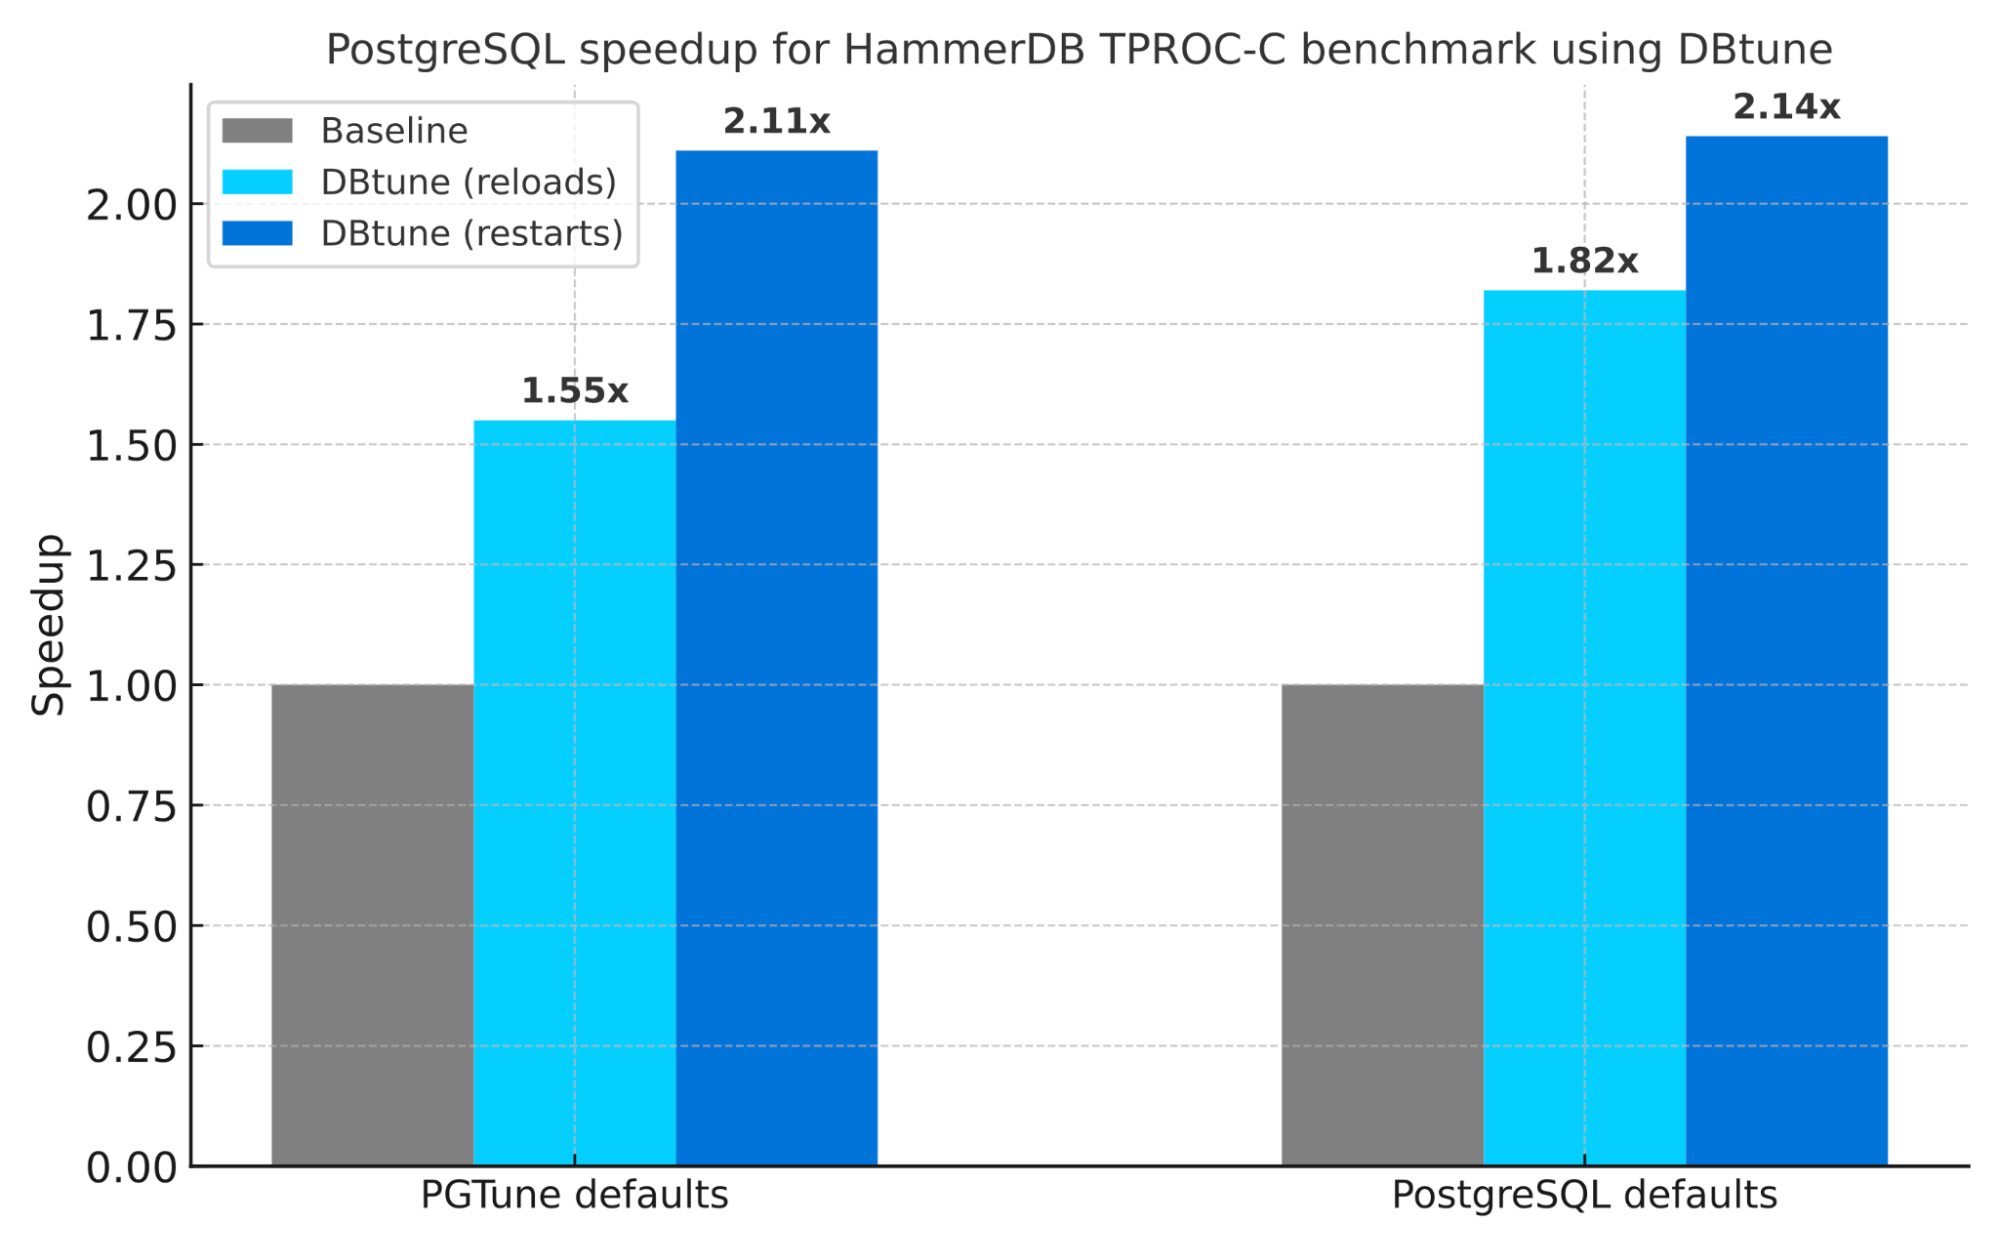
Optimization objective: TPS
| Experiment Id | Baseline | TPS speedup | AQR speedup | Notes |
|---|---|---|---|---|
| 1 (reload-only) | PGTune default | 1.55x | 1.33x | Configuration changes with service reloads |
| 2 (reload-only) | PG default | 1.82x | 2.1x | Configuration changes with service reloads |
| 3 (restarts) | PGTune default | 2.11x | 1.51x | Configuration changes with restarts |
| 4 (restarts) | PG default | 2.14x | 4.03x | Configuration changes with restarts |
Experiment 1: PGTune defaults vs DBtune (reload-only)
For the first experiment, we compared DBtune's performance against established open-source tuning tool PGTune. We applied PGTune's recommended settings, which required a PostgreSQL restart for shared_buffers and max_worker_processes adjustments, and we used these PGTune settings as our new baseline server configuration.
DBtune is used in reload-only mode despite the fact that PGTune was allowed one server restart. DBtune resulted in a 1.55x speedup in TPS, with throughput increasing from 1832 tx/s to 2845 tx/s. At the same time, AQR saw a 1.33x improvement, reducing average query response time from 47.5 ms to 35.9 ms.
The following table outlines the configuration changes DBtune made, which differ from PGTune's recommendations:
| Parameter name | PGTune setting | DBtune setting | DBtune change |
|---|---|---|---|
| shared_buffers | 8GB | 8GB | No change because reload-only |
| effective_cache_size | 24GB | 24GB | No change |
| work_mem | 6990kB | 4096kB | Decreased |
| maintenance_work_mem | 2GB | 64MB | No change |
| random_page_cost | 1.1 | 0.1 | Decreased |
| seq_page_cost | 1.0 | 0.1 | Decreased |
| effective_io_concurrency | 200 | 400 | Increased |
| shared_buffers | 8GB | 8GB | No change because reload-only |
| effective_cache_size | 24GB | 24GB | No change |
| work_mem | 6990kB | 4096kB | Decreased |
| maintenance_work_mem | 2GB | 64MB | No change |
| random_page_cost | 1.1 | 0.1 | Decreased |
| seq_page_cost | 1.0 | 0.1 | Decreased |
| checkpoint_completion_target | 0.9 | 0.9 | No change |
| max_worker_processes | 8 | 8 | No change because reload-only |
| max_parallel_workers | 8 | 8 | No change |
| max_parallel_workers_per_gather | 4 | 5 | Increased |
| max_parallel_maintenance_workers | 4 | 4 | No change |
| wal_buffers | 16MB | 16MB | No change |
| min_wal_size | 2GB | 8GB | Increased |
| max_wal_size | 8GB | 32GB | Increased |
| bgwriter_delay | 200ms | 150ms | Decreased |
| bgwriter_lru_maxpages | 100 | 300 | Increased |
| default_statistics_target | 100 | 100 | No change |
| huge_pages | try | try | No change |
Our analysis revealed one key configuration change that significantly boosted DBtune's performance:
Write-ahead log (WAL) management: DBtune produced a 4x increase in max_wal_size and min_wal_size. This adjustment allowed for greater data write capacity before checkpoints. Importantly, DBtune implements these increases safely, maintaining parameters within operationally sound thresholds that balance performance gains with system stability. This carefully calibrated reduction in checkpoint frequency helps minimize I/O spikes while ensuring the database remains within practical recovery time objectives, ultimately improving performance without compromising reliability.
DBtune also made several other parameter adjustments, including changes to query planner costs and background writer settings, though their specific impact on performance is harder to explain as individual factors.
It's worth noting that the TPCC, a standard benchmark, is likely already well-optimized by PGTune's default recommendations. Yet, DBtune significantly improved performance gains by identifying workload-specific optimization opportunities, demonstrating its advantage in workload-specific tuning, beyond static tools. Therefore, for custom, unique workloads, DBtune's adaptive approach suggests the potential for even more significant performance enhancements.
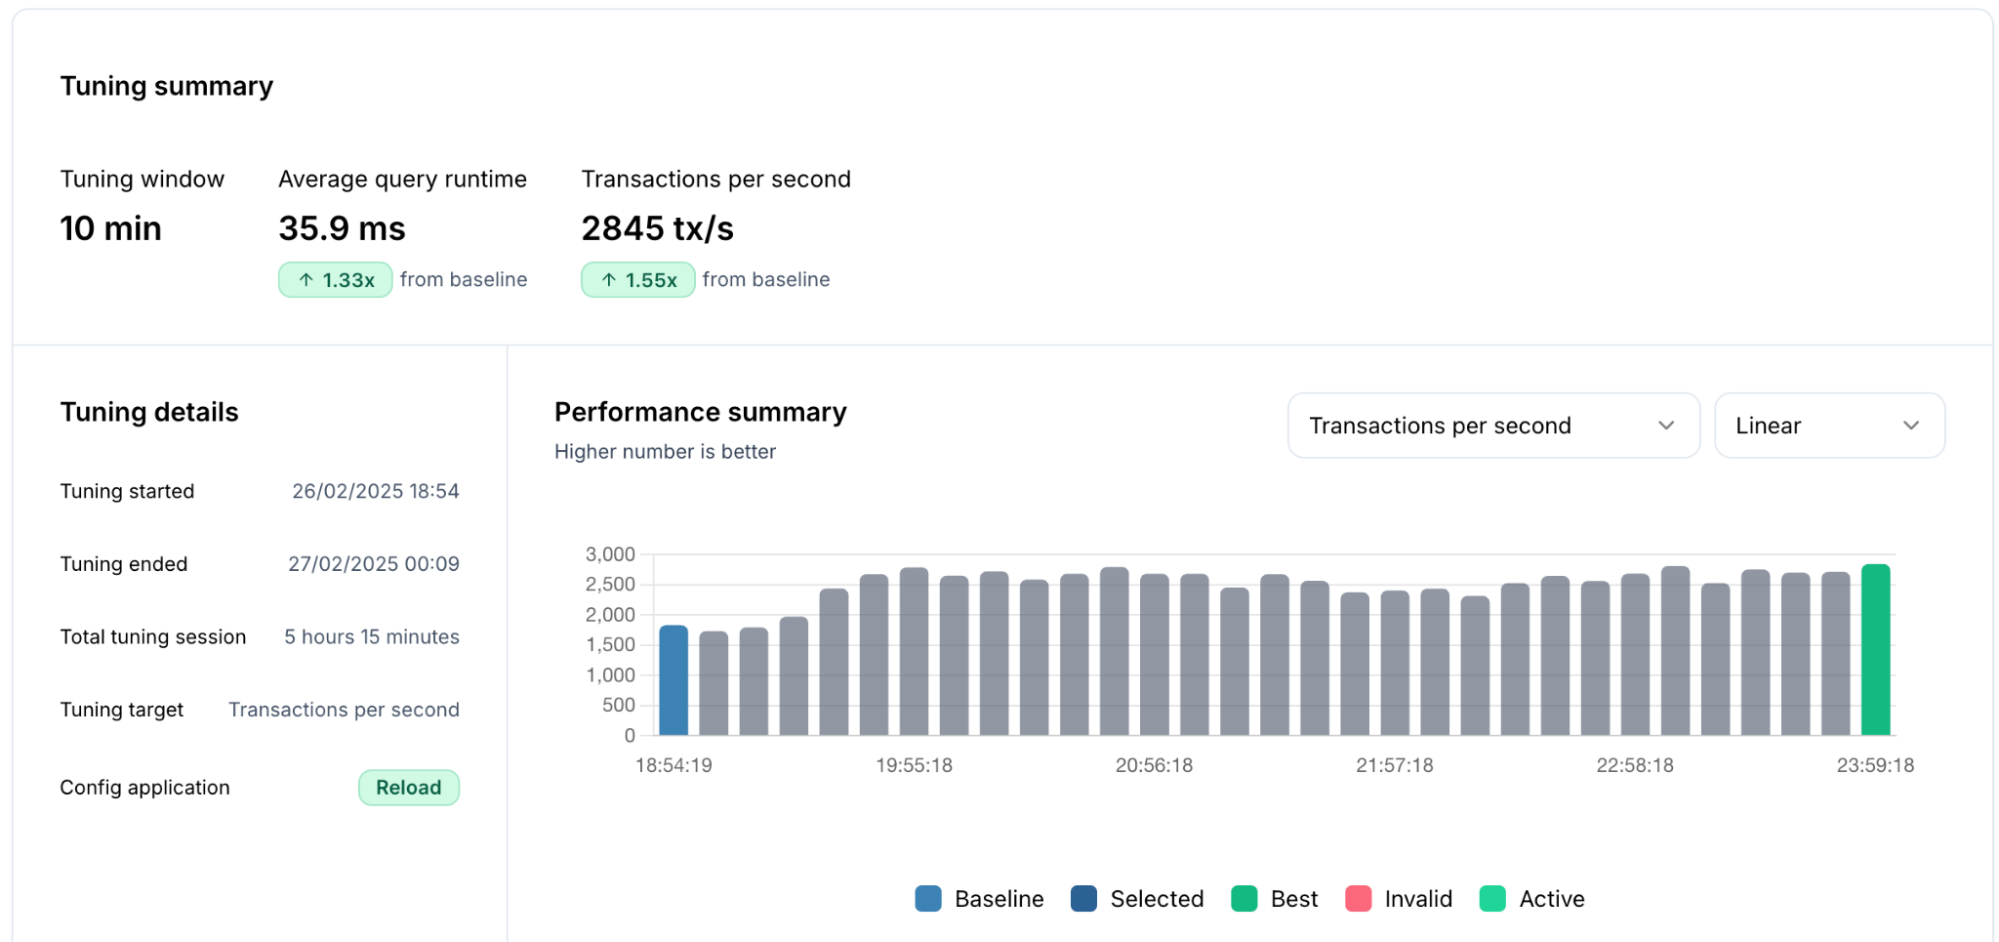
Experiment 2: PostgreSQL defaults vs DBtune (reload-only)
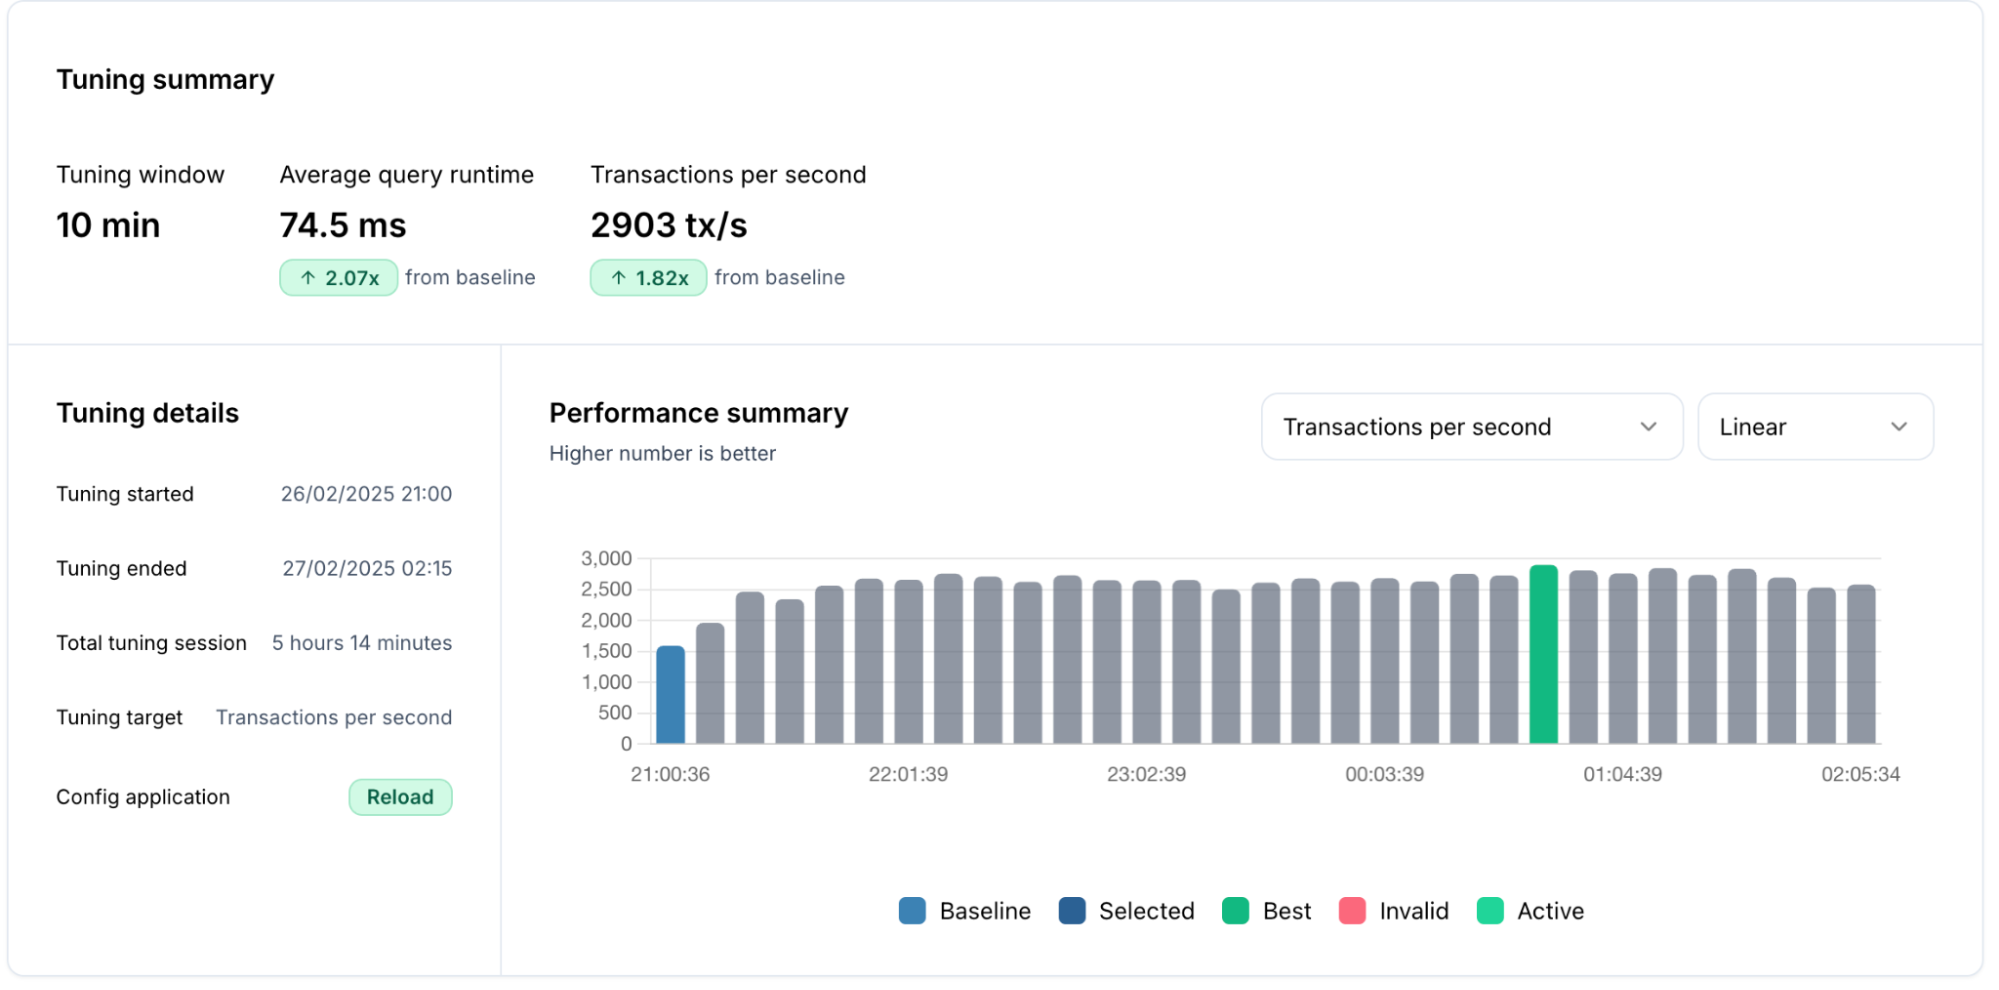
Next, we tested DBtune's performance from PostgreSQL's default parameter settings. The DBtune dashboard’s bar chart revealed progressive TPS improvement showing the transition from the blue bar to the green bar configuration.
Through service reloads, DBtune automatically adjusted PostgreSQL settings and applied them using service reloads, i.e., without requiring a database restart. This single action resulted in a remarkable 1.82x TPS speedup, boosting throughput from 1,593 tx/s to 2,903 tx/s.
Even with a TPS optimization target focus, DBtune also significantly improved the AQR by 2.1x, reducing query time by 50% (154 ms to 74.5 ms).
Similar to our first experiment, DBtune identified and adjusted several key PostgreSQL parameters, but this time starting from the much less optimized PostgreSQL defaults. The larger improvement margin demonstrates the substantial performance gap between default settings and workload-optimized configurations. It is worth noting that a very large fraction of the PostgreSQL instances run in production systems use PostgreSQL defaults, so this experiment is useful to understand what is the performance left on the table.
In practice, this improvement effectively delivers the processing power of nearly two database servers for the price of one, potentially lowering infrastructure costs and enhancing user satisfaction.
Experiment 3: PGTune vs DBtune (with restarts enabled)
Expanding on our previous PGTune and reload-only tuning experiment, we wanted to explore whether allowing database restarts could yield even greater improvements. In this experiment, we kept the same PGTune baseline settings but allowed DBtune to make more configuration changes requiring full database restarts by tuning shared_buffers and max_worker_processes as well.
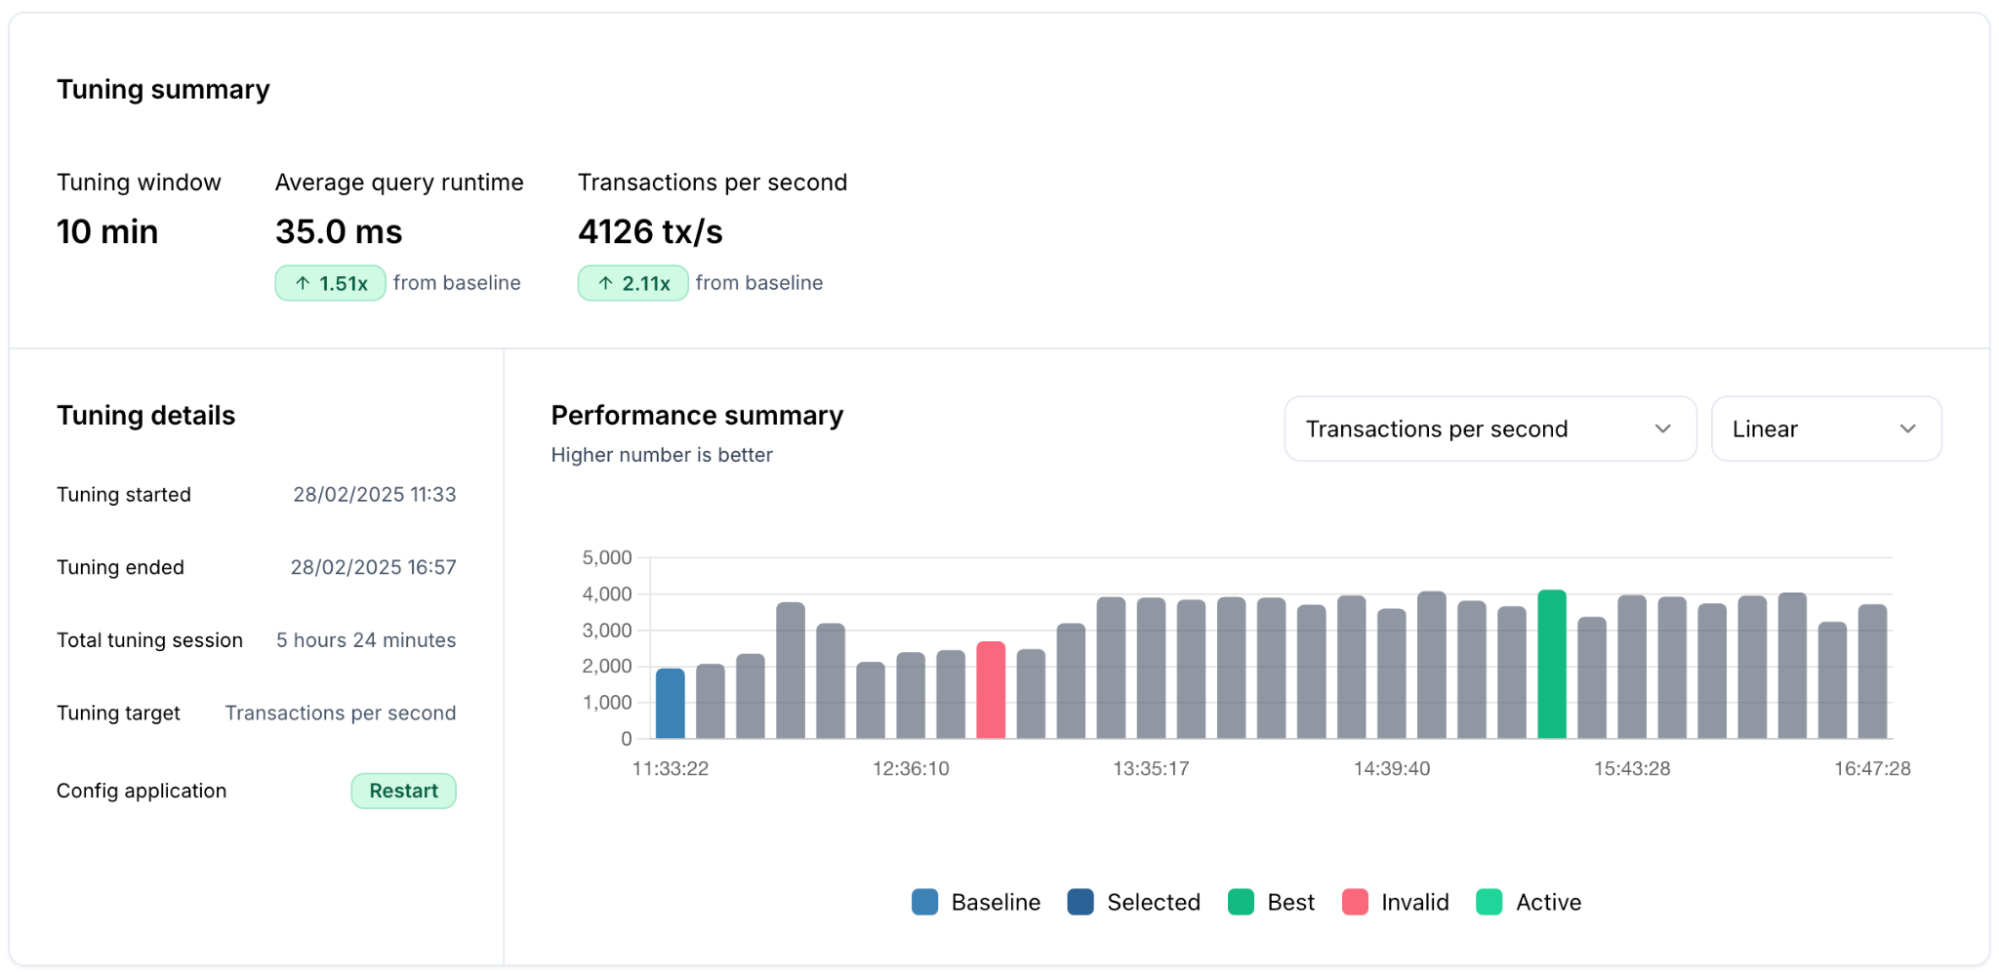
The results were remarkable – 2.11x TPS speedup, raising throughput from 1955 to 4126 tx/s, and a 1.51x AQR speedup, reducing query response time from 52.9 to 35 ms.
The red bar in the performance summary of the tuning process chart below represents a server configuration that was automatically identified by DBtune as invalid. DBtune's built-in safety guardrails detected that this configuration would consume more than 90% of available memory and immediately abandoned it. This demonstrates DBtune's ability to self-correct during the tuning process, protecting your database from configurations that could lead to memory pressure while continuing to search for optimal settings that maintain system stability.
This experiment demonstrates that while PGTune provides a solid starting point for optimization, allowing DBtune to make more comprehensive changes to fundamental parameters like shared_buffers through restarts can unlock substantial additional performance gains. Even though PGTune already sets reasonable values for many of these parameters, DBtune's workload-specific approach was able to identify more optimal settings by analyzing the actual query patterns and system behavior during the testing period.
Experiment 4: PostgreSQL defaults vs DBtune (with restarts enabled)
We also wanted to measure the maximum possible improvement when starting from PostgreSQL defaults with restart capabilities enabled. While the reload-only mode had already shown significant improvements, allowing restarts could potentially unlock even greater performance.
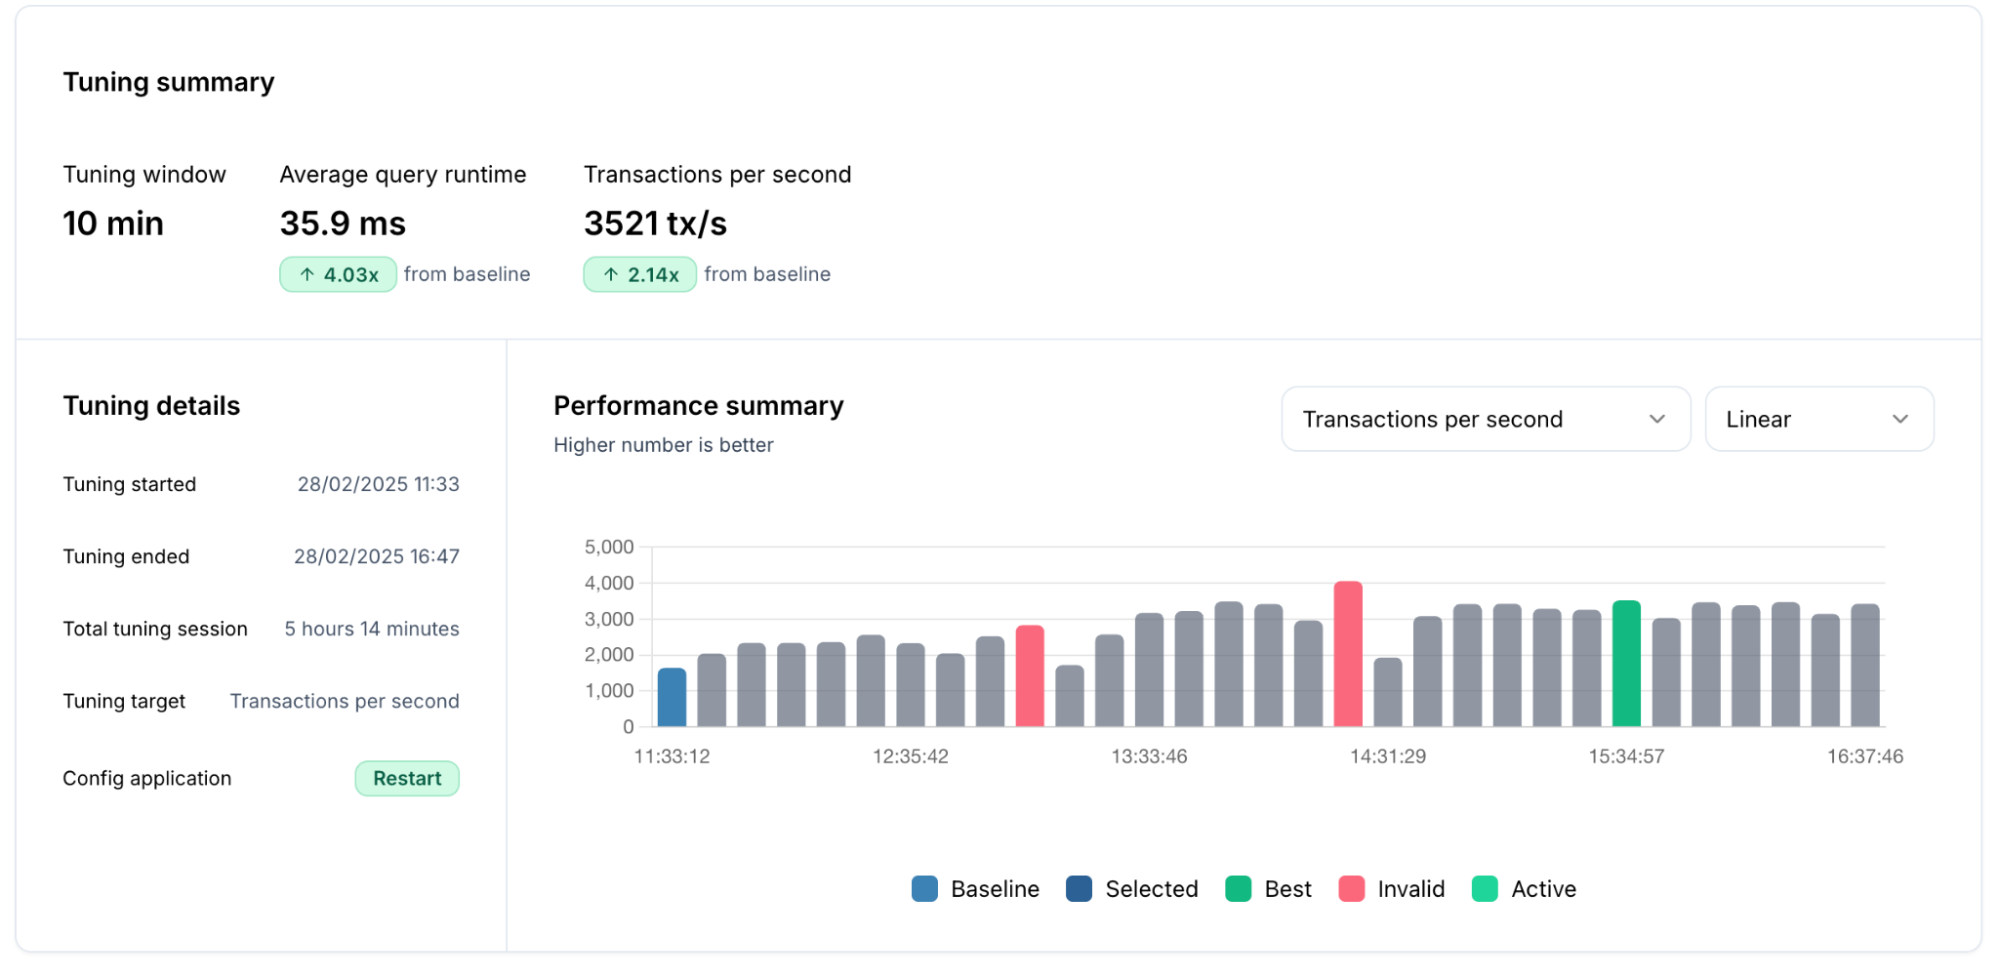
The results yielded were even more impressive, a 2.14x increase in TPS, raising throughput from 1644 to 3521 tx/s, and a 4.03x AQR speedup, reducing query response time from 145 ms to 35.9 ms.
Similar to our previous experiment, DBtune's memory protection guardrails were triggered twice during this tuning session as expressed by the red bars in the tuning summary below. This led to the automatic identification and abandonment of configurations that would have consumed excessive memory. These safety mechanisms ensured that even while exploring more aggressive optimization opportunities, the system remained protected from potentially unstable configurations.
By allowing restarts, DBtune optimized two additional parameters, shared_buffers and max_worker_processes in addition to all the parameters available in reload-only mode. While this approach requires brief maintenance windows (up to 30 restarts during the tuning session), the performance gains demonstrate that restart-based tuning can unlock additional database capacity when this downtime can be accommodated.
Tuning PostgreSQL is essential for a fair database benchmarking
This exercise demonstrates the power of DBtune for PostgreSQL performance optimization. By implementing a methodical approach with properly designed benchmark environments, we achieved remarkable performance improvements with minimal effort. We established a robust methodology for measuring PostgreSQL performance by using HammerDB's industry-standard benchmarking capabilities to objectively quantify the improvements delivered by DBtune's optimization. HammerDB's ability to generate consistent, realistic workloads was instrumental in creating reliable baselines and clearly defined performance metrics.
If you’re evaluating PostgreSQL performance using HammerDB, don’t settle for default or PGTune settings. DBtune helps you unlock PostgreSQL’s full potential with up to 2.14x TPS and 4.03x AQR performance improvement. This ensures a fair benchmark comparison against enterprise solutions such as Oracle and Microsoft SQL Server. Try DBtune and see how HammerDB PostgreSQL benchmarks can reach new heights with AI-powered tuning. Get started here.
